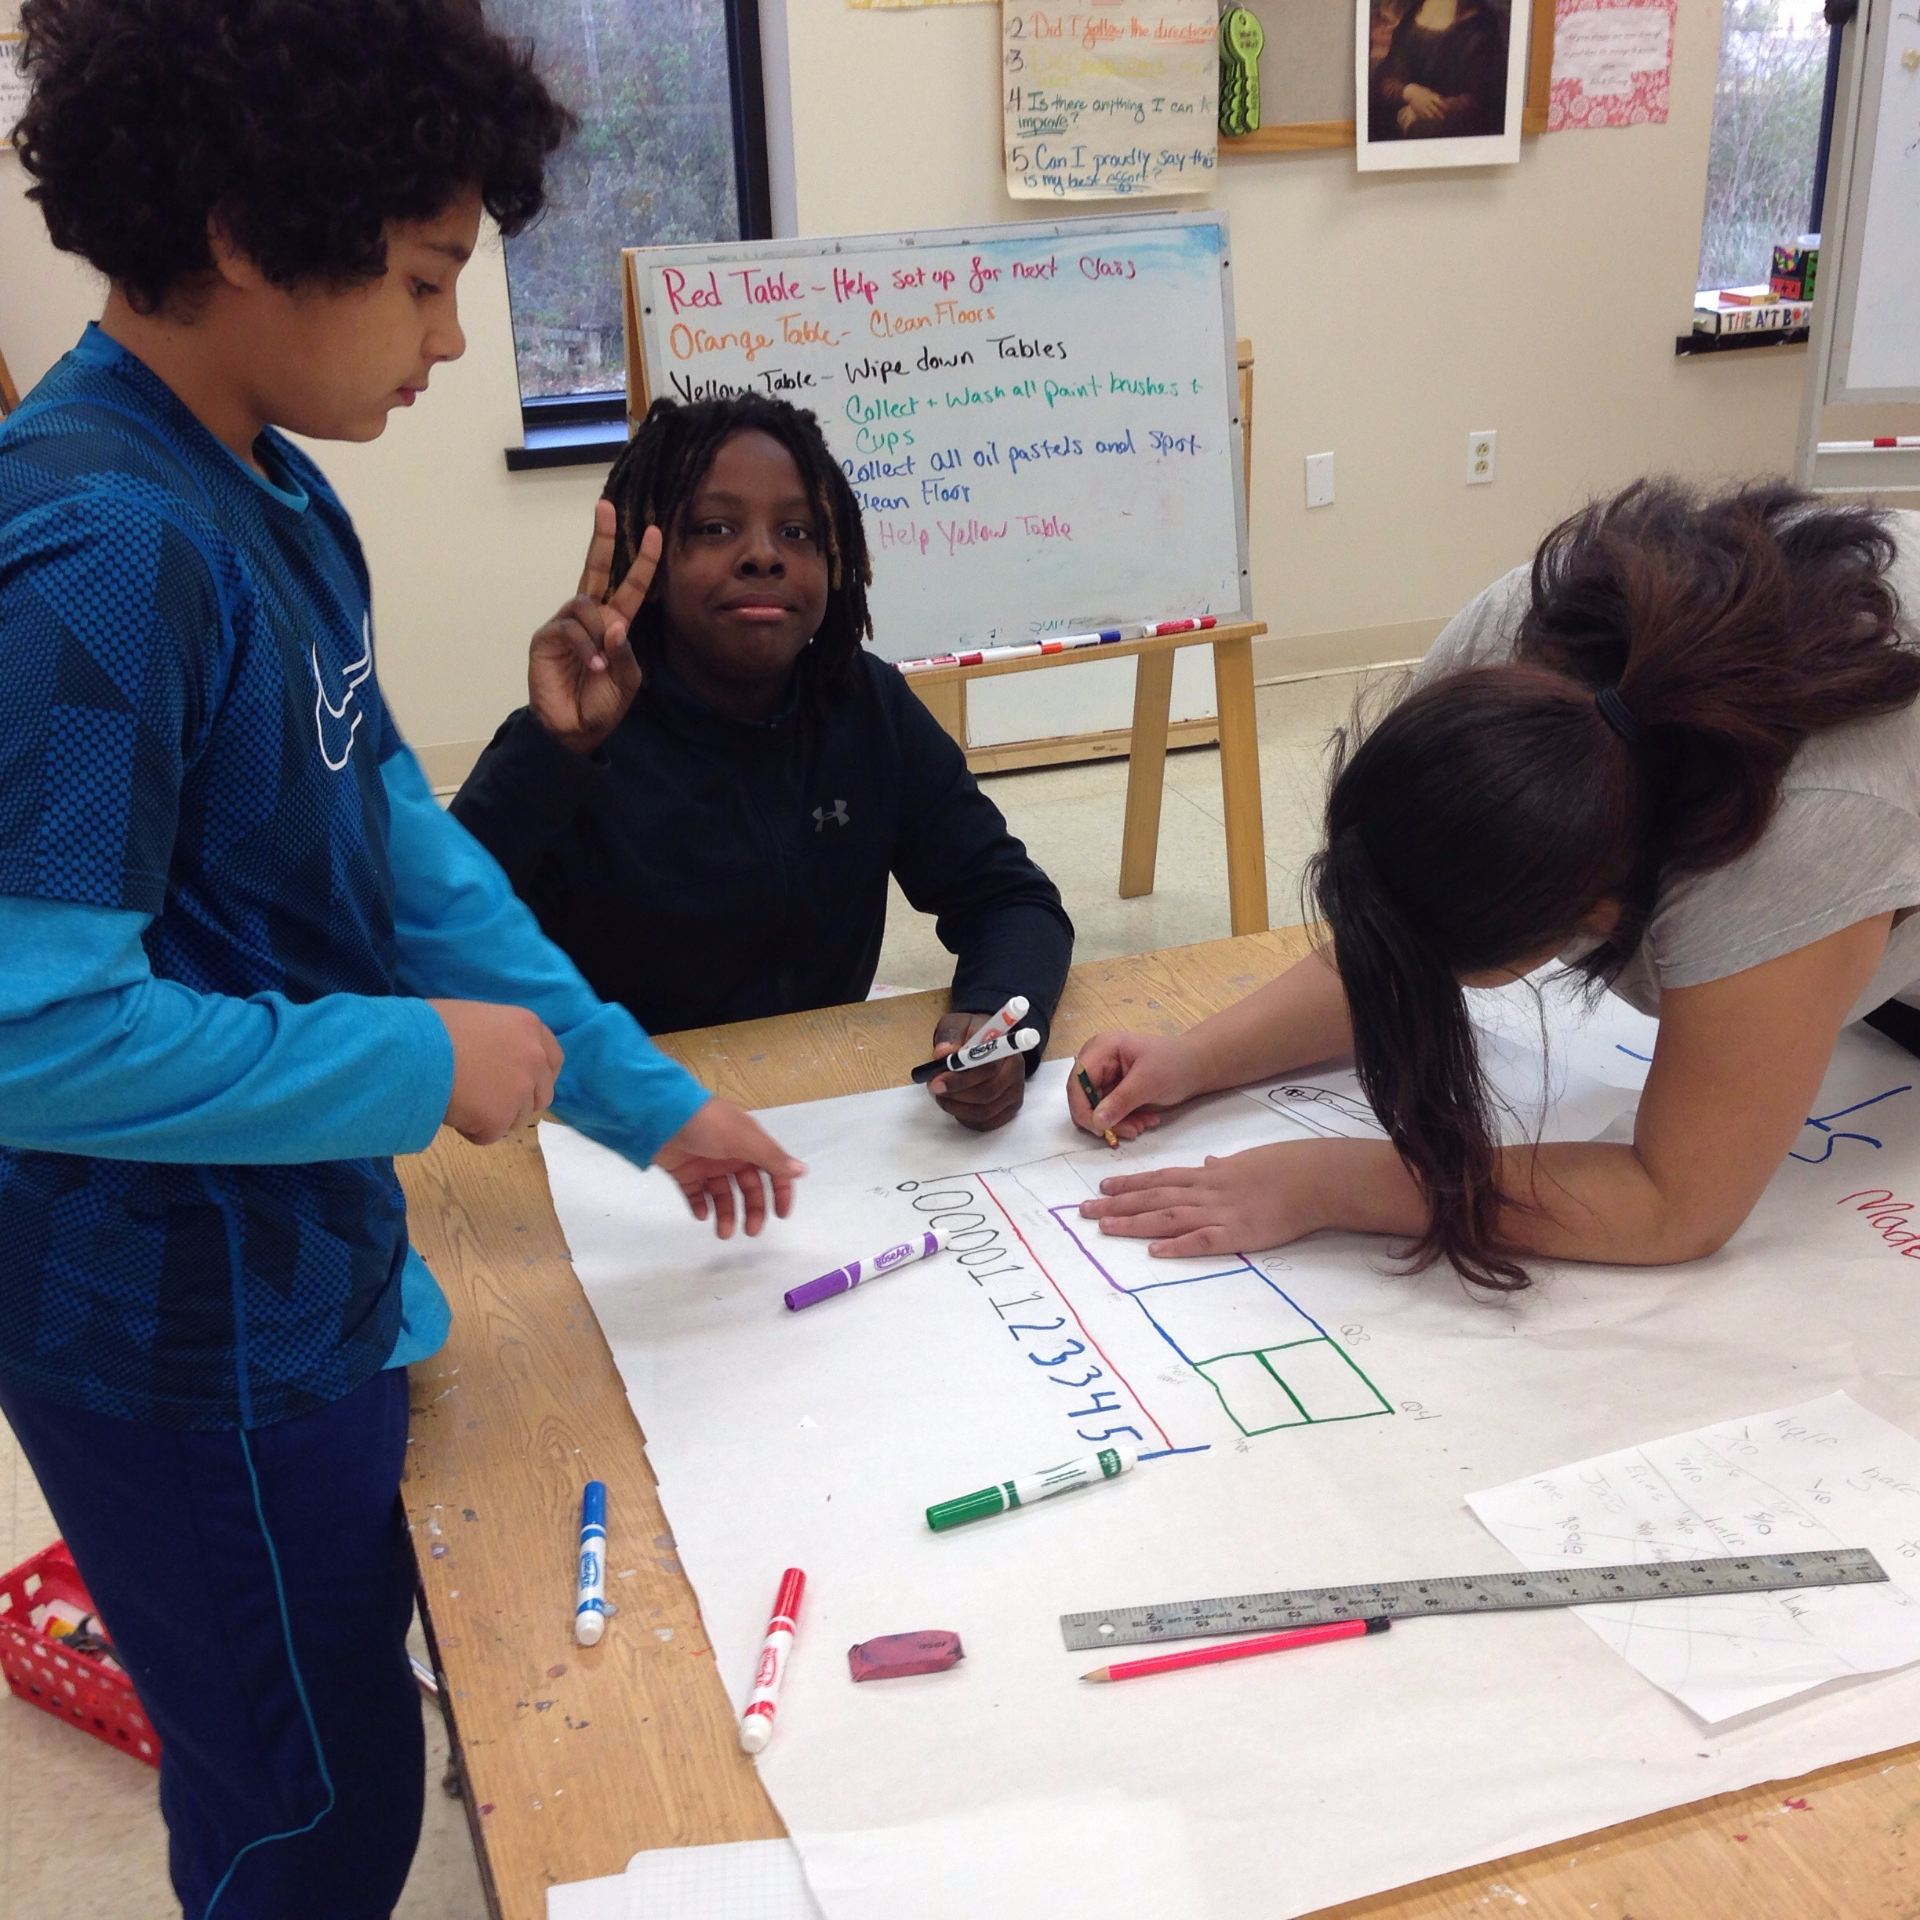
Students demonstrated an understanding of how to make and read box plots by collecting data through various activities in the gymnasium, calculating the interquartile range (Q3-Q1=IQR), comparing the data representations between a box plot and histogram, and summarizing their conclusions. Students presented their summaries to the class using posters they created in their small groups.